Setup Monitor System
This article walks through the three pillars of observability that foyer exposes out-of-the-box:
- logging via the
tracingecosystem. - metrics via
mixtrics, which forwards counters/histograms to the backend of your choice. - tail-based tracing via
fastracefor slow-operation diagnosis.
1. Setup logging monitoring
Initialize a tracing-subscriber pipeline once at process start. This example logs to stdout, includes file/line numbers, and reads filters from RUST_LOG.
# Cargo.toml
tracing-subscriber = { version = "0.3", features = ["env-filter"] }
use tracing_subscriber::{layer::SubscriberExt, util::SubscriberInitExt, EnvFilter};

tracing_subscriber::registry()
    .with(tracing_subscriber::fmt::layer().with_line_number(true))
    .with(EnvFilter::from_default_env())
    .init();
Run your binary with a filter that keeps only the interesting modules:
RUST_LOG=foyer_storage::engine::block::recover=trace,info ./your-project-with-foyer
Sample output:
2025-01-05T12:00:08.631742Z  INFO foyer_bench:432: [builder]: jemalloc is enabled
2025-01-05T12:00:08.639524Z  INFO foyer_storage::engine::block::recover:167: recovered 1_600 clean blocks in 182ms
2025-01-05T12:00:08.659042Z TRACE foyer_storage::engine::block::generic:348: enqueue hash=0x4dd185 key=42 size=1420B
2. Setup metrics monitoring
foyer records detailed counters, gauges, and histograms through mixtrics. You provide a registry implementation (Prometheus, StatsD, OTLP, …) and pass it into CacheBuilder/HybridCacheBuilder.
- Add dependencies:
mixtrics = { version = "0.2", features = ["prometheus"] }
prometheus = "0.13"
hyper = { version = "1", default-features = false, features = ["server", "http1"] } # optional exporter
- Register a metrics backend and hand it to foyer:
use foyer::{CacheBuilder, HybridCacheBuilder};
use mixtrics::registry::prometheus::PrometheusMetricsRegistry;
use prometheus::Registry;

let prometheus = Registry::new();
let registry = PrometheusMetricsRegistry::new(prometheus.clone());

let _cache = CacheBuilder::new(100)
    .with_metrics_registry(Box::new(registry))
    .build::<_>();

// Or for hybrid cache:
let _hybrid_builder = HybridCacheBuilder::new().with_metrics_registry(Box::new(
    PrometheusMetricsRegistry::new(prometheus.clone()),
));
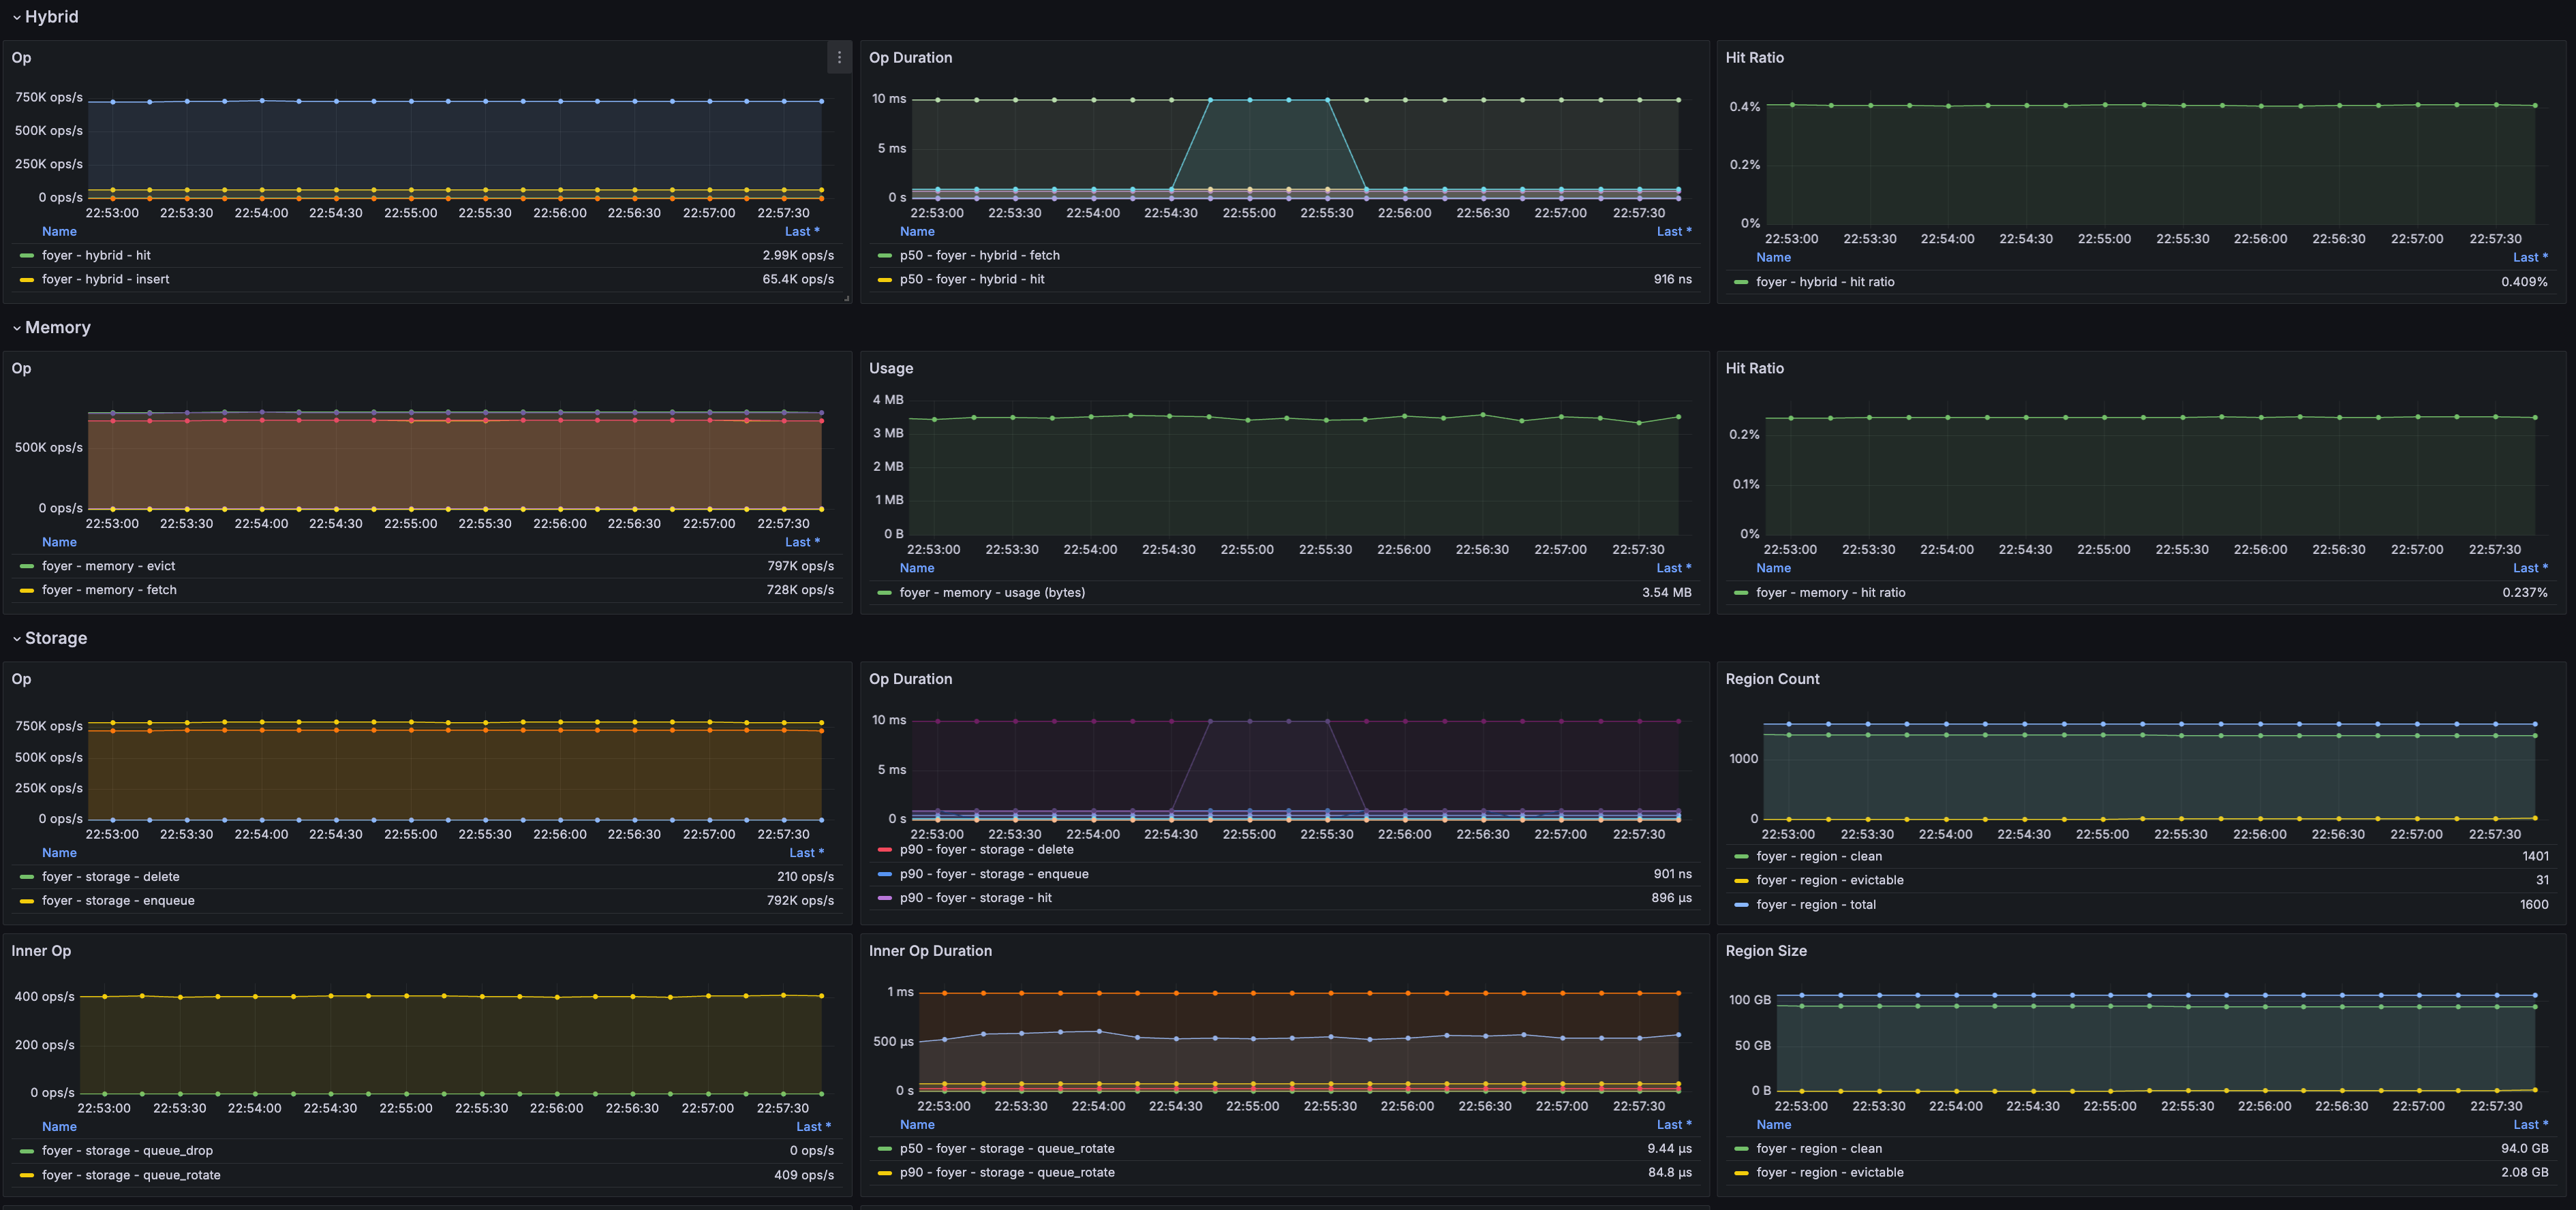
- Expose the Prometheus registry however you like. A minimal HTTP exporter is shown in
examples/export_metrics_prometheus_hyper.rs; hook it up to Grafana once Prometheus starts scraping the endpoint.
mixtrics also ships registries for StatsD and OpenTelemetry, so changing backends only requires swapping the registry type you pass to .with_metrics_registry().
3. Setup tracing monitoring
Tail-based tracing is optional and guarded by the tracing feature. Once enabled, the hybrid cache records spans only when operations exceed configurable thresholds.
- Enable the relevant features and exporters:
foyer = { version = "0.20", features = ["tracing"] }
fastrace = "0.7"
fastrace-jaeger = "0.7"          # or use fastrace-opentelemetry for OTLP
- Initialize a reporter (Jaeger example shown); use
fastrace-opentelemetryif you prefer OTLP/OTel collectors.
use std::time::Duration;

fn init_tracing() {
    let reporter =
        fastrace_jaeger::JaegerReporter::new("127.0.0.1:6831".parse().unwrap(), "foyer-demo").unwrap();
    fastrace::set_reporter(
        reporter,
        fastrace::collector::Config::default().report_interval(Duration::from_millis(50)),
    );
}
- Enable tracing on the cache and tune the thresholds with
TracingOptions.
use foyer::{BlockEngineBuilder, DeviceBuilder, FsDeviceBuilder, HybridCacheBuilder, TracingOptions};
use std::time::Duration;

#[tokio::main]
async fn main() -> anyhow::Result<()> {
    init_tracing();

    let device = FsDeviceBuilder::new("/data/foyer").with_capacity(256 * 1024 * 1024).build()?;
    let hybrid = HybridCacheBuilder::new()
        .memory(64 * 1024 * 1024)
        .storage()
        .with_engine_config(BlockEngineBuilder::new(device))
        .build()
        .await?;

    hybrid.enable_tracing();
    hybrid.update_tracing_options(
        TracingOptions::new()
            .with_record_hybrid_get_threshold(Duration::from_millis(5))
            .with_record_hybrid_get_or_fetch_threshold(Duration::from_millis(20)),
    );

    let _ = hybrid.get(&42).await?;
    Ok(())
}
Each cache operation emits a root span once it exceeds the configured latency. Exporters such as Jaeger or OTLP can now display slow inserts, disk loads, and fetches with causal relationships, making it straightforward to locate bottlenecks.